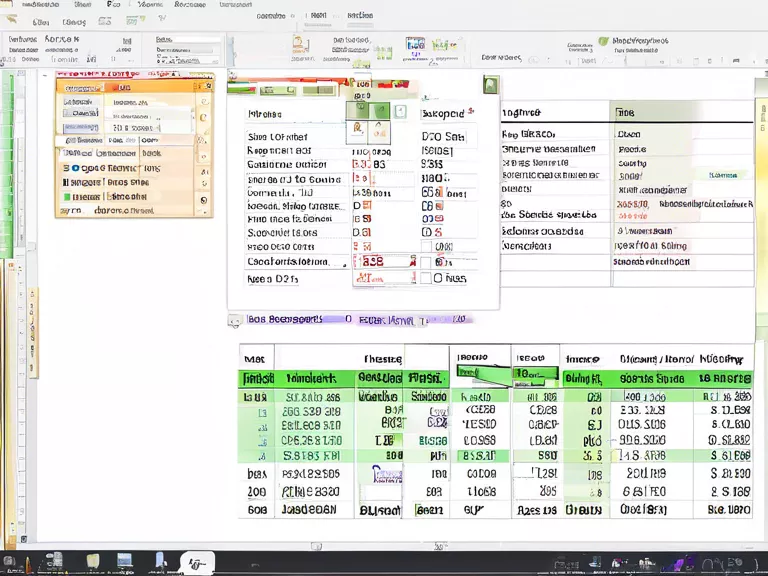
Step-by-step tutorial for creating spreadsheets and analyzing data
In today's data-driven world, the ability to organize and analyze data is a valuable skill. One of the most common tools for this purpose is Microsoft Excel, a spreadsheet program that allows users to input data, perform calculations, and create visualizations. In this step-by-step tutorial, we will guide you on how to create spreadsheets and analyze data using Excel.
Step 1: Open Excel and create a new spreadsheet
- Launch Excel on your computer
- Click on "Blank workbook" to create a new spreadsheet
Step 2: Input data
- Enter your data into the cells of the spreadsheet
- Use different columns and rows to organize the data effectively
Step 3: Perform calculations
- Use formulas and functions to perform calculations on the data
- Common functions include SUM, AVERAGE, and COUNT
Step 4: Create charts and graphs
- Select the data you want to visualize
- Click on "Insert" and choose the type of chart or graph you want to create
Step 5: Analyze the data
- Use Excel's sorting and filtering tools to analyze the data
- Create pivot tables to summarize and analyze large datasets
By following these steps, you can create spreadsheets and analyze data efficiently using Excel. Practice these skills regularly to become proficient in data analysis and visualization.


